Notifications
Clear all
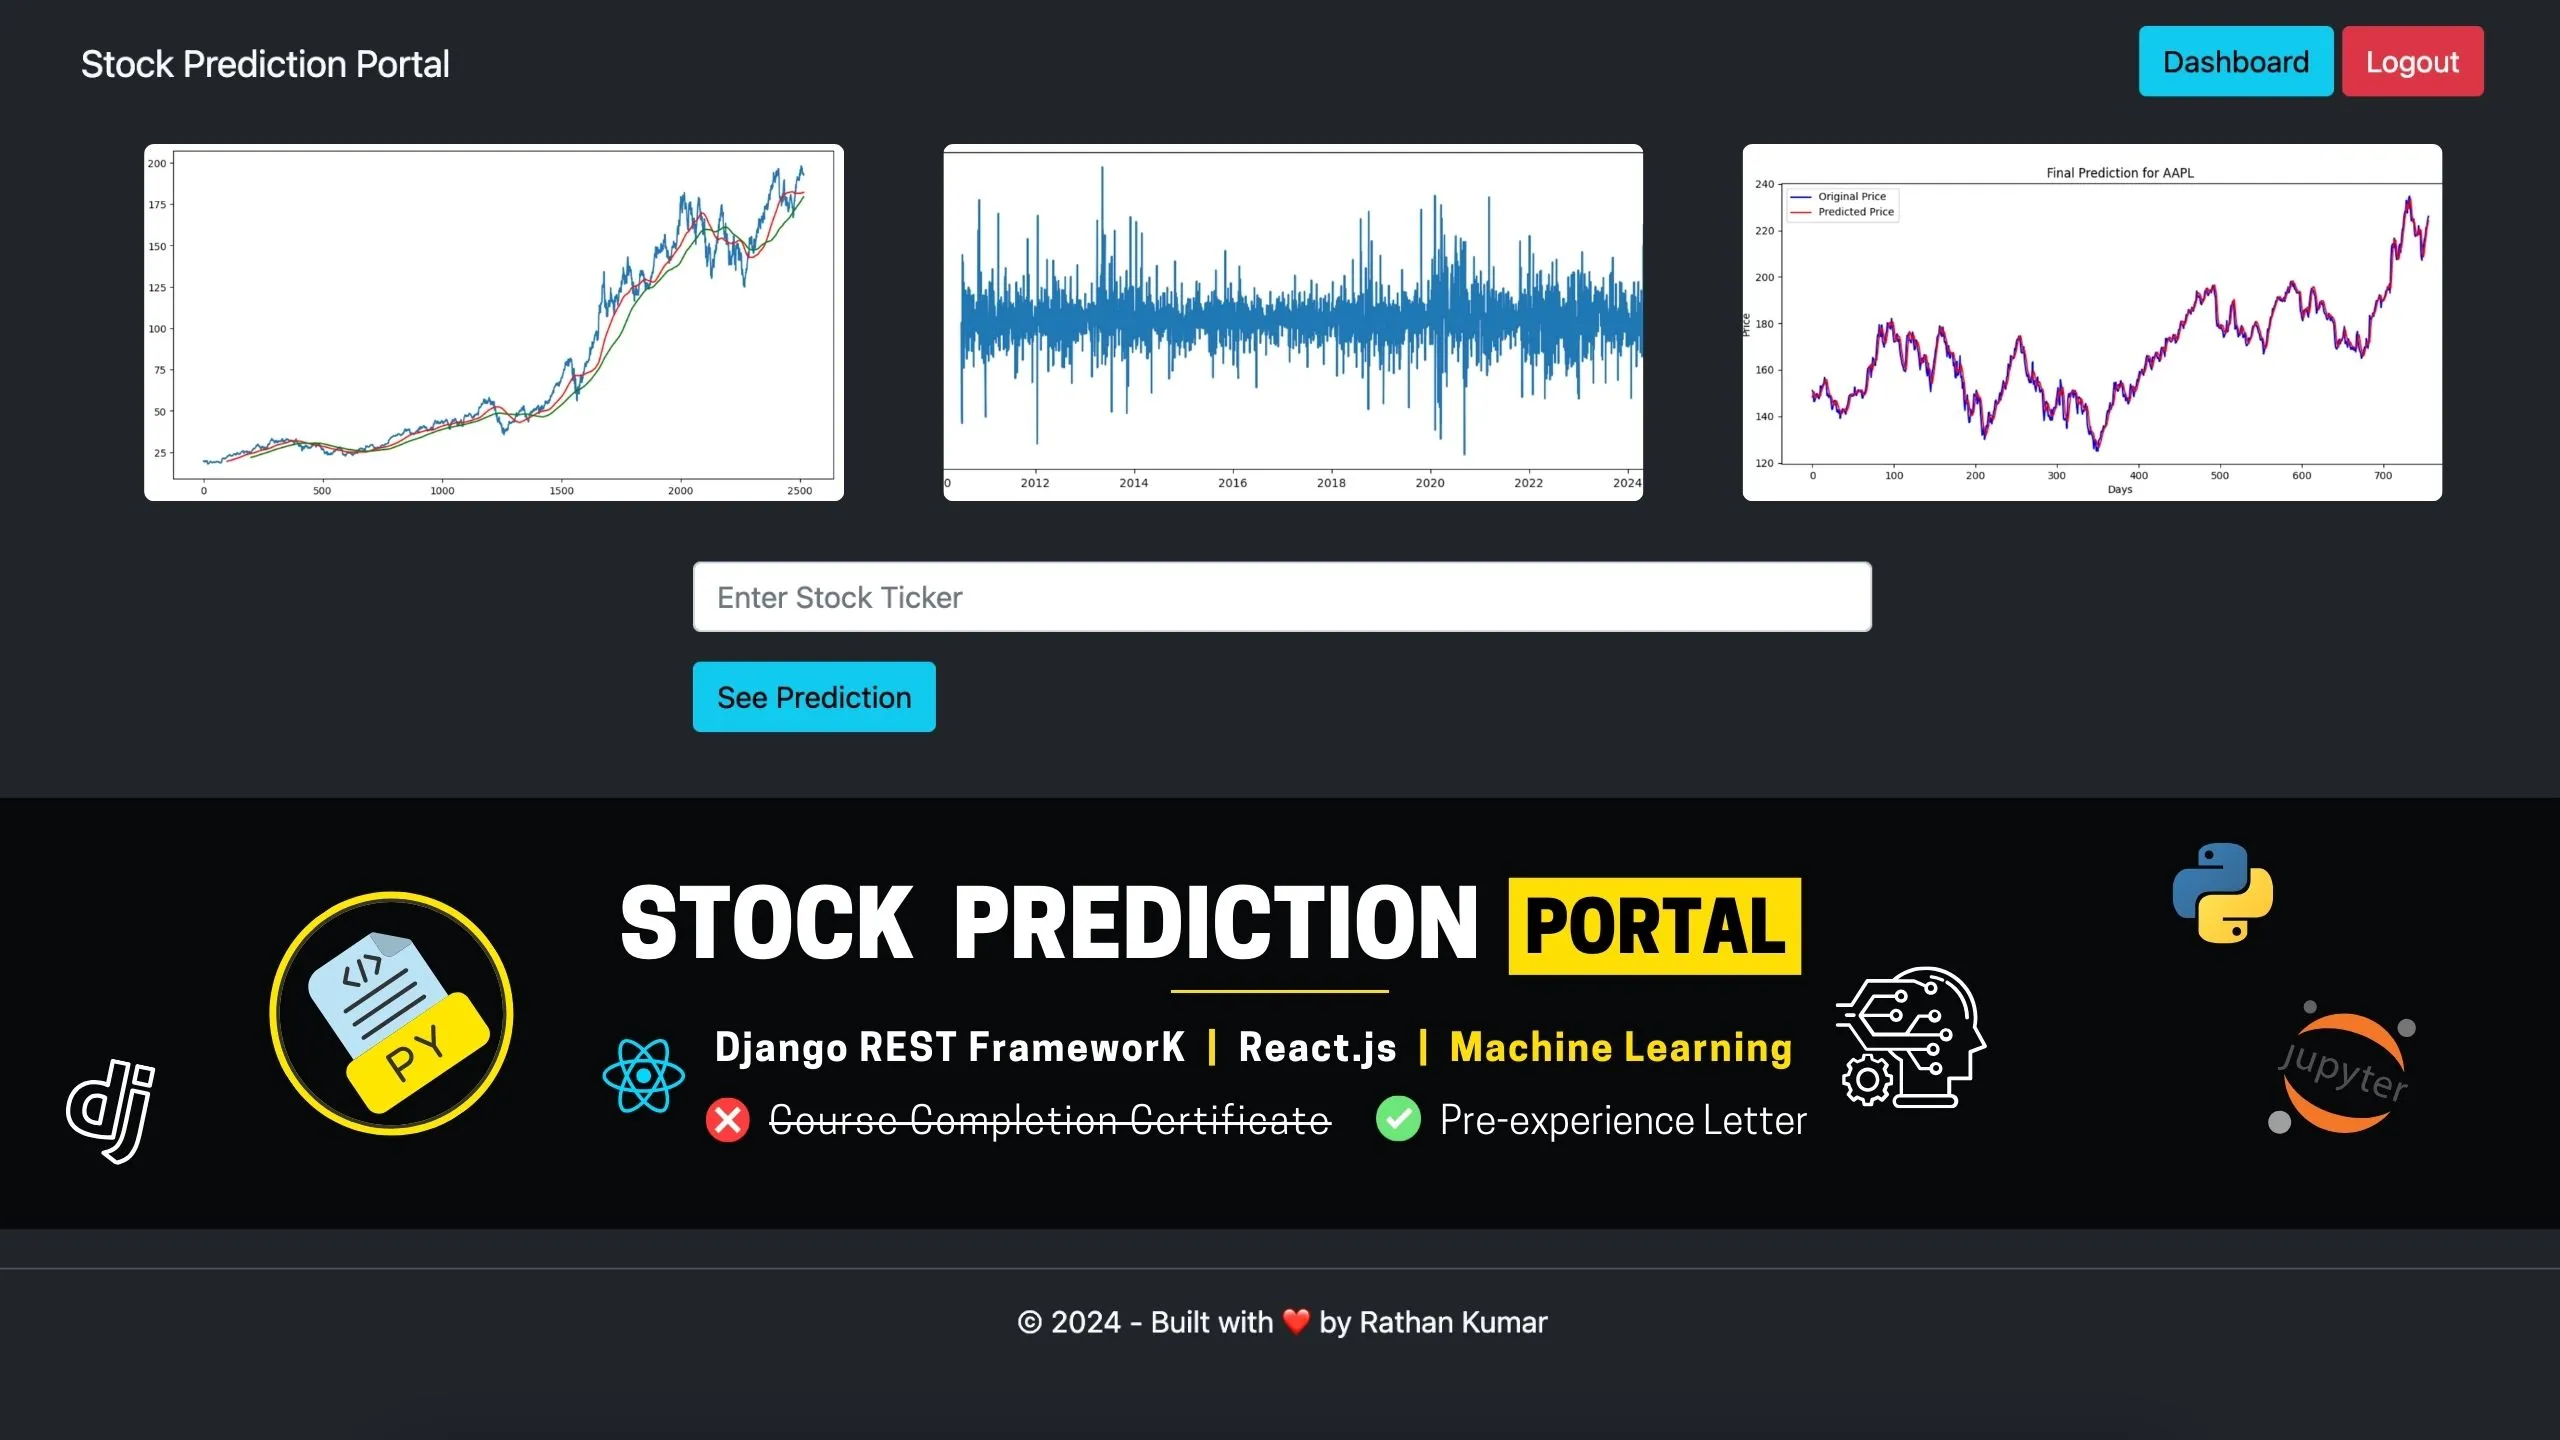
Build a Stock Prediction Portal – Django, React & Machine Learning
1
Posts
2
Users
0
Reactions
248
Views
0
16/03/2025 12:33 pm
Topic starter
Hi,
When I'm doing this :
import matplotlib.pyplot as plt
import pandas as pd
import numpy as np
import yfinance as yf
from datetime import datetime


now = datetime.now()
start = datetime(now.year-10, now.month, now.day)
end = now
ticker = "AAPL"

df = yf.download(ticker, start, end)
df
I get only 5 columns when you get 6 columns. I get :
| Price | Close | High | Low | Open | Volume |
|---|---|---|---|---|---|
| Ticker | AAPL | AAPL | AAPL | AAPL | AAPL |
| Date | |||||
| 2015-03-16 | 27.904795 | 27.904795 | 27.440274 | 27.665834 | 143497200 |
| 2015-03-17 | 28.371550 | 28.434081 | 28.061124 | 28.116956 | 204092400 |
| 2015-03-18 | 28.690907 | 28.845003 | 28.221919 | 28.362615 | 261083600 |
| 2015-03-19 | 28.474283 | 28.865107 | 28.451951 | 28.753443 | 183238000 |
| 2015-03-20 | 28.116959 | 28.675276 | 27.951697 | 28.641778 | 274780400 |
| ... | ... | ... | ... | ... | ... |
What is wrong please ?
Thanks
Emmanuel
1 Answer
0
17/03/2025 3:53 pm
It looks like you're missing the 'Adj Close' column in your DataFrame. However, your code is correct, and this shouldn't be happening. Since this issue is occurring, you can try upgrading the yfinance package by running the following command and then try again:
If the issue persists, it’s possible that there was a temporary discrepancy with the data or an update on Yahoo Finance’s end. Please run the command and let me know if it gets fixed or not.